Behavioural Anomaly Detection
Eight-dimension behavioural profiling — built into the ledger itself.
Most fraud systems apply static rules: block over a fixed amount, flag a new country, reject velocity above a threshold. Rules are easy for a determined attacker to probe and step around, and they generate steadily more noise as legitimate business patterns evolve. Every rule you add makes tomorrow's tuning harder.
LedgerFlow learns instead. The engine builds a picture of each account's own normal behaviour from its history and surfaces genuine departures from it — no rule library to write and maintain, no separate machine-learning platform to buy, staff and operate, and no external service in the path of your payments.
It is part of the ledger, so it scores as transactions post, not overnight.
The Midnight Problem — and Why Most Systems Get It Wrong
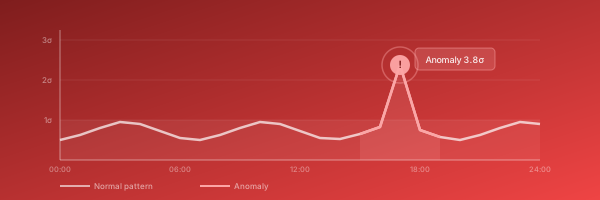
Time of day is a cycle, not a straight line. 23:50 and 00:10 are twenty minutes apart. Treat the clock as an ordinary number and those two moments look almost as far apart as it is possible to be — so their average lands at midday, which is nowhere near either of them.
The consequence is not academic. A customer who reliably transacts around midnight appears statistically extreme at 23:59 and again at 00:01. Systems built on ordinary averages either drown overnight businesses in false alerts, or have their overnight monitoring switched off by an exhausted operations team — which is how genuine overnight fraud goes unseen.
LedgerFlow models time as the cycle it actually is. Baselines wrap correctly through midnight, so the engine understands that late-night and early-morning activity form one continuous pattern.
In practice: a merchant who settles every day around midnight has a tight, correctly-centred baseline. A transaction at 14:00 is a real fourteen-hour departure and is flagged. One at 00:10 is barely off-pattern and is ignored.
No rules to write. No thresholds to hand-maintain. The baseline updates itself from history, and it follows the business as the business changes.
Eight Anomaly Dimensions → One Composite Score
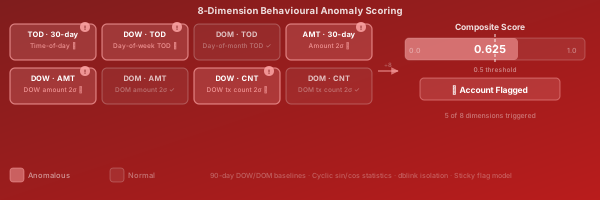
Every transaction is assessed across eight independent dimensions the moment it posts. Each either agrees with the account's established pattern or does not, and the results combine into a single composite score between 0.0 and 1.0.
One number is the design goal. An analyst opening the dashboard needs to know where to look first, not to interpret eight separate readings for every account on the book.
The diagram shows an account with five of eight dimensions triggered — comfortably past the default threshold, so it is flagged and surfaced for review.
The threshold is configurable per account profile. High-volume merchants can sit at a stricter setting to keep noise down; accounts under enhanced monitoring can be made deliberately more sensitive. Because thresholds are inherited from profiles, an entire category of accounts is retuned in one change rather than one at a time.
Time-of-Day Profiling
The simplest and most effective single signal: is this happening at an unusual time of day for this account?
Each account accumulates a rolling short-term picture of when it habitually transacts, expressed as a normal range rather than a fixed window. A new transaction is compared against that range — with midnight handled correctly, so the small hours are not treated as extreme by default.
Cold-start protection: an account must have established a genuine pattern before this signal can fire. A brand-new account is never flagged simply for lacking history — the classic way that behavioural systems make themselves unusable during customer onboarding.
The window refreshes continuously, so the baseline tracks the account as it is now, not as it was when it opened.
Day-of-Week and Day-of-Month Profiling
Normal behaviour is not uniform across the calendar. A business that runs payroll on the last Friday of the month looks unusual on any other Friday — and that is perfectly normal.
LedgerFlow keeps separate baselines per day of the week and per day of the month, each built over a longer window than the short-term profile. A transaction is compared against the pattern for its own day, so Monday-morning activity is never judged against Saturday-evening behaviour, and month-end activity is never judged against mid-month.
This is what separates a system your compliance team trusts from one they learn to ignore. Calendar-driven businesses — payroll, subscription billing, month-end settlement — are precisely the ones that a naive model flags relentlessly and wrongly.
The longer window lets monthly and seasonal patterns stabilise while staying recent enough to follow legitimate change in the business.
Amount Anomaly Detection
Is this amount unusual for this account?
Each account carries a continuously-maintained picture of its typical transaction size and how much that ordinarily varies. Amounts that fall well outside the account's own established range are flagged.
Critically, the comparison is per account. A £40,000 transfer is entirely routine for one customer and a serious red flag for another, and any system using a single global amount threshold is wrong for almost everyone — too loose for retail customers, too tight for corporates, and constantly being adjusted for both.
Cold-start guard: amount signals stay inactive until the account has enough history to have a meaningful normal. New accounts are not penalised for a single unusual first transaction.
Velocity Anomaly Detection
Is this account transacting far more than usual today?
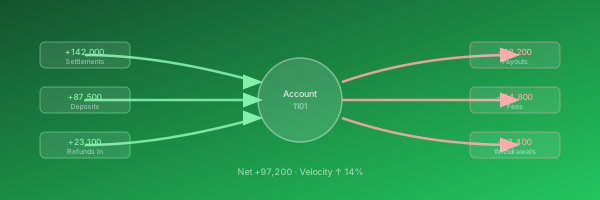
Velocity tracks how many transactions an account processes, again compared against its own norms for that day of the week and that day of the month. A merchant that normally handles 200 transactions on a Monday and suddenly handles 2,000 is flagged — even when every individual transaction looks perfectly ordinary.
That is the whole point of this dimension. Card testing, account enumeration and automated payment farming are invisible transaction by transaction; they are only ever visible in the aggregate. A system that inspects transactions one at a time cannot see them at all.
The separate day-of-month view handles businesses with monthly rhythms: a subscription run on the 1st should not raise an alert on the 1st, but the same volume appearing mid-month should.
Scoring, Tamper Resistance, and the Sticky Flag
One score. The eight dimensions combine into a single value from 0.0 to 1.0, and an account crossing its configured threshold is flagged. Operators tune the threshold per account profile without touching code or waiting on a release.
Flags survive rollback — by design. Anomaly flags are recorded independently of the transaction that triggered them. If the original transaction is subsequently rolled back, the flag still stands.
This closes an attack that catches naive implementations: probe the system with a transaction, watch whether it trips detection, then deliberately fail the transaction so the evidence disappears with it. Here, the attempt is recorded whether or not the transaction ever completes. You see what was tried, not merely what succeeded.
Sticky flags prevent dilution. Once flagged, an account stays flagged until an operator explicitly clears it. Without this, an attacker could bury a flag under a flood of ordinary transactions before anyone reviewed it — quietly restoring their own good standing. They cannot: a flag is cleared by a human decision, and never by volume.
Clearing a flag is itself a fully audited event, attributed to the operator who made the call. The decision to stop watching someone is exactly the decision that most needs a name against it.