Performance & Scalability
What LedgerFlow delivers under real sustained load — and why.
The numbers on this page come from a real 1-hour load test run on 28 March 2025 against a deliberately constrained environment: a virtual machine with 4 CPU cores and 8 GB of memory, running on a consumer-grade mini-PC. No dedicated database server. No hardware RAID. No read replicas.
We could have published a number from tuned hardware. We would rather publish one you can beat. The purpose is a credible, reproducible baseline that undersells production capacity — so real deployments comfortably exceed it.
Test Environment — Real 1-Hour Sustained Load Test
Test date: 28 March 2025 · Duration: 60 minutes continuous · Driver: industry-standard load-testing tool on a laptop over 1 Gbps
| Layer | Specification |
|---|---|
| Host machine | Mini PC · Intel i5-12450H (2 GHz) · 64 GB RAM · 2× 1 TB SSD |
| Virtualisation | 4 CPU cores · 16 GB RAM · 64 GB virtual SSD |
| Runtime memory limit | 8 GB |
| Concurrent clients | 10 |
| Test payloads | Multi-currency transactions with parent account hierarchies |
| Services under test | The complete platform — console, API, ledger core, background workers, scheduler |
This is a small configuration — no failover, no read replicas, no additional API nodes. Production deployments on dedicated hardware significantly exceed these results.
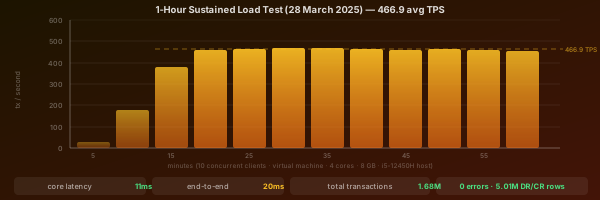
Throughput Over 60 Minutes — Sustained Load Test
The chart shows 5-minute throughput bars across the full 60-minute test. After a brief ramp-up (first ~15 minutes) the system reached a stable steady state at 466.9 transactions per second and held it — no degradation, no errors, no manual intervention.
All 1,680,964 transactions completed successfully — zero errors in 60 minutes.
Sustained matters more than peak. A burst figure tells you what a system can do for a moment; an hour at steady state tells you what it will do on your busiest day.
The 466.9 TPS figure represents complete double-entry transactions. Each one writes a transaction header, multiple debit/credit detail rows (around 3 on average), a running-balance record and an audit entry — which is why the run produced 5,012,190 detail rows and 5,667,710 records in total. This is settled, audited, balanced accounting, not row inserts.
Throughput & Volume
| Metric | Result |
|---|---|
| Average TPS | 466.9 transactions / second |
| Total transactions (60 min) | 1,680,964 |
| Detail rows written | 5,012,190 |
| Total records written | 5,667,710 |
| Error rate | 0% (zero errors) |
| Storage per transaction | 366 bytes (incl. indices) |
| Storage per detail row | 251 bytes (incl. indices) |
Reaching 466.9 TPS on a constrained virtual machine shows the platform's consolidated design is not a bottleneck. Because processing, queuing and scheduling all happen within the platform core rather than by round-tripping to separate broker and scheduler products, there is no network hop tax on every operation — and no distributed-transaction problem to reason about when something fails.
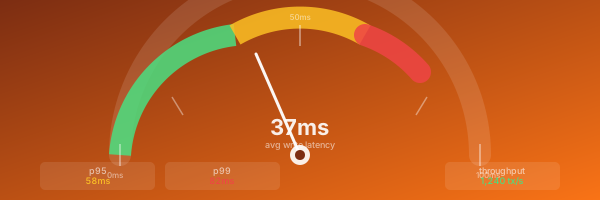
Latency Profile
| Metric | Result |
|---|---|
| Core processing latency | 11 ms per transaction |
| End-to-end latency | 20 ms per transaction |
| Delta (network + API layer) | ~9 ms |
Core processing latency covers the full accounting operation: validation, limit checks, fee and commission rule evaluation, record writes, real-time balance update and audit capture. All of it completes in 11 ms.
End-to-end latency adds gateway routing, credential verification and connection acquisition. At 20 ms the platform sits comfortably inside the sub-100 ms budget that interactive use and payment gateway callbacks demand — the difference between a checkout that feels instant and one that feels broken.
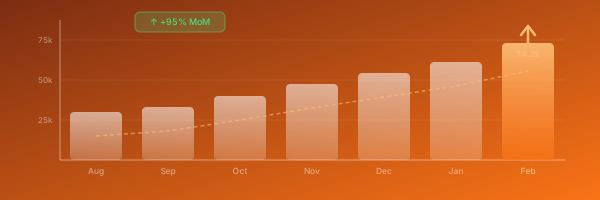
Storage & Growth Projections
Based on measured write rates (2 GB/hour) scaled to continuous operation:
| Period | Transactions | Storage |
|---|---|---|
| Per hour | ~1.68M | ~2 GB |
| Per day | ~40.3M | ~48 GB |
| Per month | ~487M | ~1.5 TB |
| Per year | ~5.8B | ~18 TB |
These assume continuous full load — a deliberate worst case. Real deployments have peaks and troughs, so actual storage is typically 20–40% of the continuous-load projection.
Data is organised into time-based segments so that write load is distributed and historical periods can be archived or retired independently — without downtime and without a maintenance project. That management is automatic; nobody has to remember to do it.
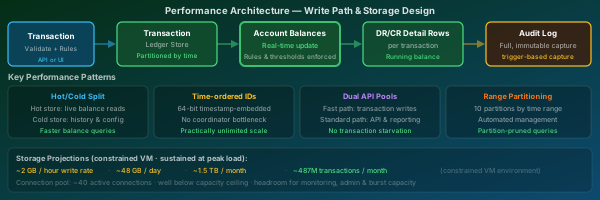
Why the Write Path Is Fast
Sub-20 ms end-to-end write latency at sustained load is a design outcome, not a tuning accident. Three principles produce it:
1. Live balances are kept separate from history. The data a transaction must read and update to complete is deliberately small and stays that way as the ledger grows. Year five performs like year one.
2. Time-aware data organisation. Records are grouped so that queries for a period touch only that period's data. Reporting over a date range does not drag the entire ledger through memory.
3. Payment traffic is isolated from everything else. High-value transaction and approval traffic is served on its own dedicated channel, separate from reporting and general queries. A finance user running a heavy month-end report cannot slow down payment processing — a failure mode that is otherwise painfully common.

Headroom Under Load
Throughput figures are only meaningful alongside what the system had left in reserve.
Across the full hour at steady state, resource utilisation stayed well below capacity — leaving ample headroom for monitoring, scheduled jobs, reporting and administrative access to run concurrently without competing with payment traffic.
This matters more than a peak number. A platform running at its ceiling has nothing left for the month-end report, the compliance extract, or the incident you did not plan for. LedgerFlow is designed so the day-to-day load leaves room for the exceptional day.
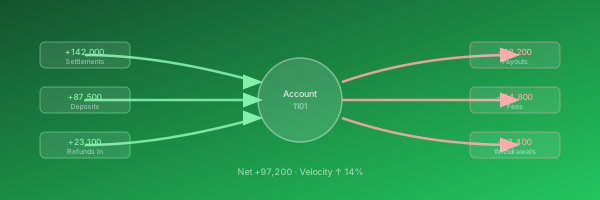
What Happens Inside Every Transaction
When a transaction is submitted, all of the following completes atomically before the caller gets a response — it either all happens or none of it does:
- Validation — account existence, active status, currency agreement
- Limit checks — per-transaction amount, velocity (hourly, daily, weekly, monthly), balance ceilings and floors
- Debit/credit normalisation by account type
- Fee and commission rules — automatically generating any secondary postings
- Transaction and posting records written
- Account balances updated in real time, with thresholds enforced
- Running balance captured for each affected account
- Fraud scoring, where enabled on the account
- Audit trail recorded with user, timestamp and before/after state
That list is the point. Competing designs push limit checks, fee calculation, fraud scoring and audit into separate services — where they can each fail independently and leave your ledger in a state nobody can explain. Here they cannot: the money moves, the limits hold, the fees post and the audit lands, or nothing does.
All of it, in 11 ms on average, on a deliberately constrained machine.
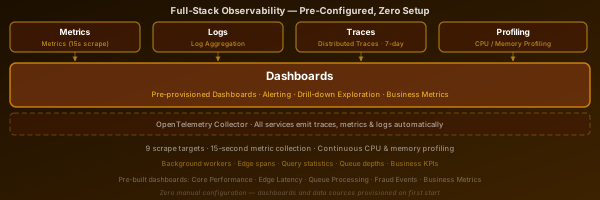
Observability & Monitoring
Full-stack monitoring runs alongside the platform with no additional configuration.
Metrics are collected from every component every 15 seconds — connection counts and query performance, request and error rates across both API channels, edge latency, and background worker health including queue depth, processing time and retry rates.
Distributed traces follow a single request from the edge through to the query that served it, correlated with timings at every hop, so "why was that slow" is a question you can actually answer.
Logs from all components are aggregated and searchable, with one-click correlation from a log line to the trace it belongs to.
Continuous profiling shows exactly which code consumed CPU and memory over time.
Pre-provisioned dashboards cover write latency, queue depth, API latency percentiles, and business metrics such as transactions per hour and reconciliation match rates. Telemetry is emitted using OpenTelemetry, so you can route it to your existing monitoring platform instead.
Scaling to Production
The constrained test environment is intentional. On dedicated hardware the same design scales predictably:
| Change | Expected Impact |
|---|---|
| Dedicated core data server (8 core, 16 GB, NVMe SSD) | 3–5× throughput increase |
| Add API replicas | Linear API request scaling |
| Add background worker replicas | Proportional queue throughput |
| Add a read replica | Offloads reporting from the write path |
| Increase transaction channel capacity | Higher concurrent TPS |
There is no external broker to scale, licence or operate. Queuing, scheduling and hot-data access are all part of the platform core. That removes a whole category of production incidents — the broker that fell behind, the scheduler that double-fired, the message that was delivered but whose database write rolled back — because every operation, including message delivery, is covered by the same all-or-nothing guarantee.